Last June, we posted an article showing why large and mid-cap Brazilian stocks were due for a bounce. We used a chart of the iShares MSCI Brazil Index ETF (NYSE Arca: EWZ) to highlight nearby support at 31.37 and fallback support at 29.12.
In the weeks following our post, EWZ tested the first support twice before climbing to approach the previous high. With share value having increased more than 40% in the move up from the support level, now may be time for Brazilian stock bulls to manage their positions and take profits. The next phase of the pattern is likely to be downward.
On the updated weekly chart below, you can see how the bounce since last summer consisted of three waves. We believe it represented the middle ‘b’ wave of a corrective pattern. Based on standard Fibonacci measurements of the smaller moves within that ‘b’ wave, the most likely resistance areas that can produce a downturn are near 45.39, 47.88, and 51.03.
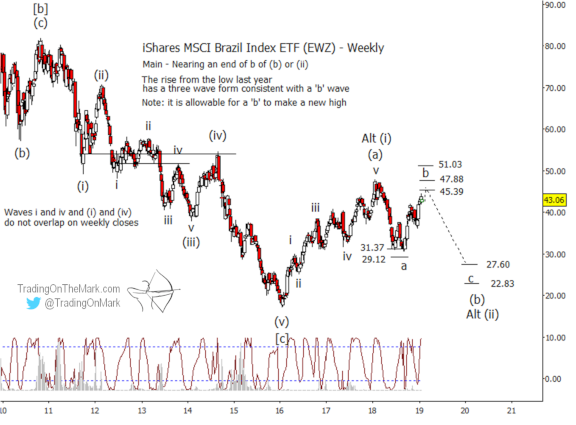
Note how the Lomb periodogram is just now printing values near the upper end of its range. Since the Lomb represents an estimate of whether price is at an upper or lower extreme of a cycle, the reading suggests that a downward turn should be relatively more probable during the next few weeks.
If a reversal kicks in as expected, then initial rough estimates put downward targets for wave ‘c’ near 27.60 or 22.83. We will refine those targets after it is clear that wave ‘b’ has concluded.
Follow Trading On The Mark on Twitter for more frequent updates about ETFs and futures!
Readers of our emailed newsletter will also receive an exclusive offer in February to save on TOTM subscription packages.