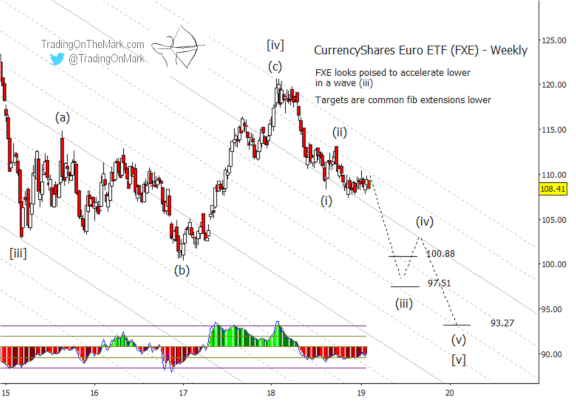
Consistent with our recent posts about a likely bounce in the U.S. Dollar and a corresponding decline in the British Pound, we believe the Euro is on the verge of a potentially steep drop. Traders should be prepared, because the drop may turn out to be a strong “middle third” wave in Elliott wave parlance.
In this special article for readers of our emailed newsletter, we show the key areas to watch with the leading Euro currency ETF and also Euro futures on a weekly time frame. Then we zoom closer to look at potential entry areas on a much more detailed daily chart!
For our email readers, there’s also an exclusive way to cut the cost of any month-by-month subscription at Trading On The Mark. It’s described at the end of this email.
Let’s start by looking at the Euro ETF.
In recent weeks the CurrencyShares Euro ETF (symbol FXE) has been pushing sideways against a type of channel resistance. It appears weaker than the British Pound ETF (FXB), which made an upward retrace into and slightly above a resistance zone we identified a few weeks ago.

Meanwhile the Dollar ETF (UUP) has been gaining upward momentum. If the Dollar breaks higher, we should start to see opposing movement in the Euro.
The next downward move should be a strong one.
We’re treating the Euro’s decline from a year ago as the initial part of an impulsive fifth wave downward. In many impulsive waves, the middle part (the middle third wave) is the strongest. That phenomenon occurs slightly less often inside a larger fifth wave, but it is still reasonable for bearish Euro traders to assign the greatest probability to the scenario where downward sub-wave (iii) is stronger than the completed sub-wave (i). Some Fibonacci-related supports to aim for include 100.88 and 97.51.
The downward channel on the FXE chart has worked reasonably well for several years on a weekly time frame, so traders should particularly watch for the intersection of support areas with channel lines as a function of time.
If you’re trading futures…
Below is shown the weekly futures chart that our subscription members received on February 3. For traders looking at the Euro with a bearish mindset, the Fibonacci retracement levels marking possible completion areas for upward wave ‘ii’ represent potential entry opportunities.
Note, during the nine days after this chart was created the Euro has pushed slightly downward, away from 1.1581 resistance. There is a chance the Fibonacci resistance levels on a weekly time frame will be tested again, and so they are still relevant. However that kind of retest is not guaranteed. (A newer chart is shown at the end of this email.)

A more recent chart:
The daily chart shown below is more current, and it shows the areas where bearish traders might watch for a smaller upward retrace to complete. Our members received the chart this morning.
Two stand-out resistance levels for a retrace sit at 1.1405 and 1.1435 for the March contract.
On the other hand, if those resistance levels break, it lends weight to an alternate scenario in which the recent low might have been a small ‘b’ wave. That would allow another upward segment of wave [II] to form. We’ll be watching each day for any signs of that kind of alternate scenario taking place.
Sticking with the more bearish main scenario for now, a good preliminary target for downward wave [III] awaits near 1.1229.

You’re trading with an advantage when you have up-to-date charts.
A Daily Analysis subscription at TOTM gives you constant access to up-to-date with charts on weekly and daily time frames for the Euro, the Dollar Index, gold, crude oil, bonds and the S&P 500. Right now you can try that subscription for a month at a substantially reduced price.
We’re making this offer available exclusively to readers of this newsletter. Check out the Subscribe page at Trading On The Mark and use the coupon code “EXCLUSIVE” to cut 15% off the price. (Use all capital letters with the coupon code.)
The special offer works for our Intraday Analysis too, in addition to Daily Analysis.
Good fortune to you in your trading!
— Tom and Kurt at Trading On The Mark
