The resistance area we mentioned in January for the Brazilian stocks ETF appears to have held. Now it’s time to watch for signs that a downward impulse is forming.
Our January post about the iShares MSCI Brazil Index ETF (NYSEARCA: EWZ) examined the upward correction that had begun in September 2018. At that time, we noted that the bounce had formed very near the support we had identified seven months earlier, in June.
We noted that the move from June to January appeared to be nearing completion, and that it had already produced a share increase of more than 40%. We anticipated a reversal, and the recent decline from resistance at 45.39 is a good sign the reversal might have occurred.
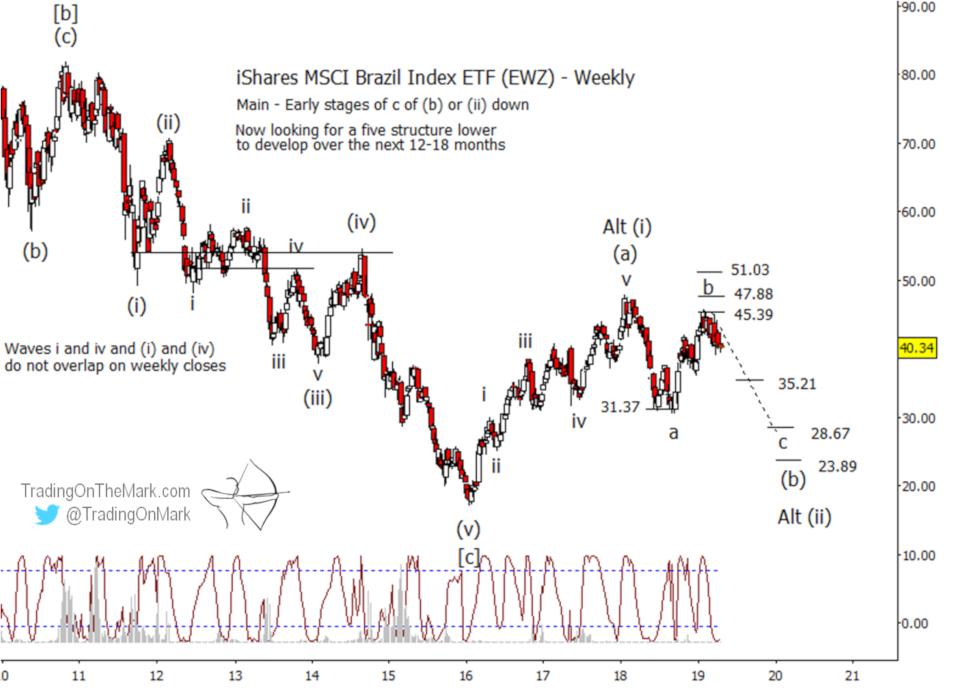
A downward impulse from here would probably not reach beneath the early-2016 low, although even that is possible. The most important Fibonacci-related supports on the way down exist at 35.21, 28.67, and 23.89. Of those, we expect at least the first support to be overcome, perhaps after some consolidation.
In our January post, we also noted that the Lomb periodogram (visible at the bottom of the chart) suggested that price was near the peak of the cycle that was apparent on a weekly chart. The recent decline in EWZ coincided fairly well with the cycle peak. The Lomb periodogram is a type of spectral analysis that has some advantages over the more common Fourier analysis.
Trading with the right charts gives you a real edge. Readers of our free emailed newsletter receive exclusive charts, analysis and opportunities to save on TOTM subscription packages. You can also follow Trading On The Mark on Twitter for chart updates.