Our July 2019 chart for the CurrencyShares Japanese Yen Trust (NYSEARCA: FXY) showed the fund testing resistance at 89.24, and we also said it could test the next higher resistance at 90.41 before declining. That’s exactly what happened.
This week we show what to watch for confirmation that the expected larger downward trend really has resumed. There should be some trade entry opportunities soon.
Recall that the Yen has been working through a contracting range since August 2016. We count that contraction as an Elliott wave triangle, and it occupies the place of wave [iv] in what will probably turn out to be a large five-wave decline from the 2011 high.
As of now, the structure of the final wave (e) of the triangle appears complete, and the strong rejection from resistance at 90.41 lends credence to the idea that downward wave [v] has begun.
The supports that need to break for confirmation of this scenario are 86.71 and possibly 85.70, but only after an upward retrace that counts as wave (ii).

Likely candidates for resistance that could cap wave (ii) sit at 88.11 and 89.07. As is typical with this kind of analysis, the break of support confirming the scenario would happen some time after the “ideal” trade entry moment.
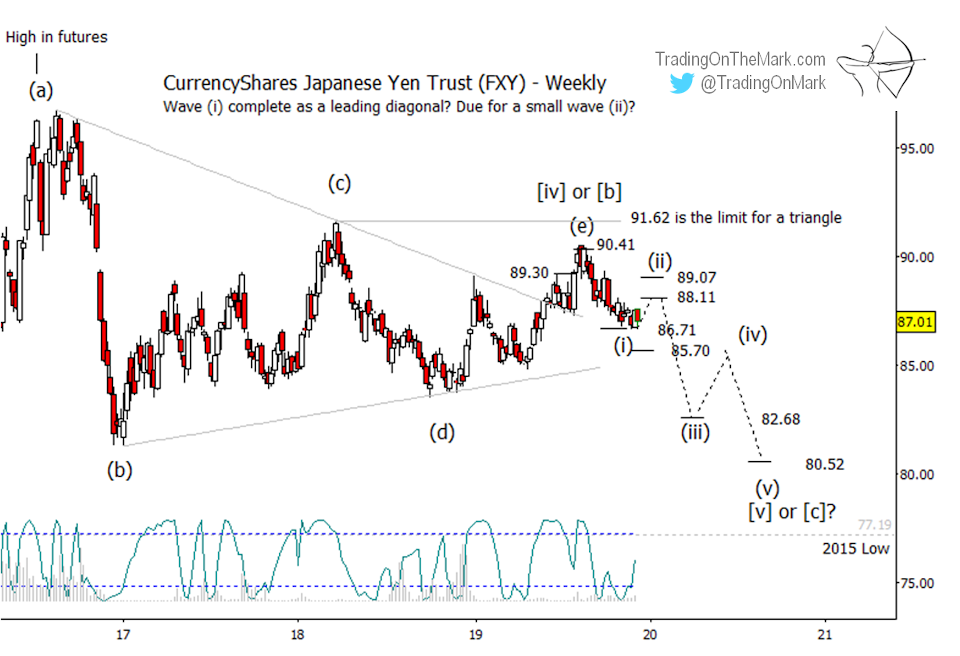
Note that the Lomb periodogram is signaling that now is a likely time for an upward reversal of some type. That is consistent with the expectation of a wave (ii) bounce.
The next lower support and resonance levels at 85.61, 82.68, and 80.52 are merely preliminary based on a Fibonacci-related technique. We will be able to identify more fine-tuned targets when it is apparent that upward wave (ii) has finished playing out.
It’s easier to find the trades when you start with the right charts. Right now you can get access to all the charts and lock in a deep 20% price reduction with the coupon code YULE.
We’re also rolling out a new feature that lets subscribers receive charts and posts by email.