REMINDER: Starting on Presidents’ Day weekend, Feb. 13-15, we’ll begin posting all updates at tradingonthemark.substack.com. If you’re already a subscriber to our service here, we’ll arrange to have your access continue there without interruption.

Moving to new platform
This is just a reminder that we'll be posting all of our new content at tradingonthemark.substack.com starting today. If you're currently a subscriber to Trading On The Mark, you should have...
The Day Ahead: AM Edition 2021-02-12
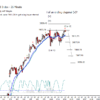
Alas the February 8th low in bonds turned into only being a very small degree three down from January 28th.
First Look: 2021-02-12
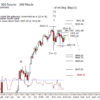
The S&P 500 futures fell initially overnight but have been rising this morning after they couldn't break under 3887.75.
Moving to new platform
This is just a reminder that we'll be posting all of our new content at...
The Week Ahead: 2021-02-07
Bonds had a tough week last week but I stubbornly think a more meaningful bounce is due. The...
The Week Ahead: 2020-01-31
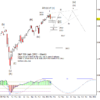
Bonds had a pretty eventful week last week pushing up to test 171^04 but closed back near where it started the week.


Hit your targets
We believe an independent trader can succeed and profit in the markets, and we’re committed to helping our subscribers trade well on the time frame that best suits them. We founded Trading On The Mark in 2008 to help traders overcome some of the challenges of market analysis and trade execution. If trading futures and options based on technical analysis appeals to you, then you’re the kind of trader we want to work with.TOTM’s technical approach is grounded in Elliott wave and Gann techniques, while also making use of Fibonacci relationships in price and time, historical cycles analysis, proprietary technical indicators, and other more esoteric methods.
What people say about TOTM
If you love trading, I highly recommend Tradingonthemark! Tom, Kurt offer great charts and other technical stuff. It has improved my trading! — Moiz, intraday trader and long-time subscriber