My premium content
Morning & evening updates
We chart the S&P 500, crude oil, the Euro, Dollar Index, treasury bonds, and gold, typically with a morning and evening post for every trading day.
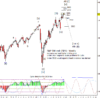
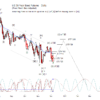
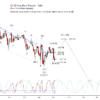
The Week Ahead: 2020-12-13
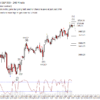
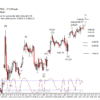
Bonds bounced up to initial resist last week but still looks too shallow to my eye.
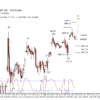
The Day Ahead: AM Edition 2020-12-11
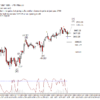
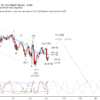
Bonds continue to work higher as per plan.
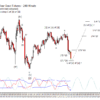
First Look: 2020-12-11
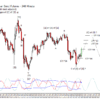
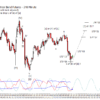
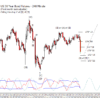
S&P 500 futures have been lower after the bounce in the day session yesterday.
The Day Ahead: PM Edition 2020-12-10
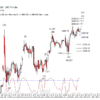
Bonds staying on forecast by moving up on Thursday to test the moving averages and 172^19.
The Day Ahead: AM Edition 2020-12-10
Bonds have moved up from 172^01 but have yet to test 173^09.
First Look: 2020-12-10
S&P 500 futures tested critical support at 3649.75 this morning if bulls are to have another chance at a new high.
The Day Ahead: PM Edition 2020-12-09
Bonds slipped a bit early but bounced from support at 172^02.
The Day Ahead: AM Edition 2020-12-09
Bonds at some support at 172^01 and have more at 171^23.
First Look: 2020-12-09
S&P futures hit an intraday target yesterday in the the evening at 3714.50 which makes me a little hesitant to try to stretch from 3719.00 today.
The Day Ahead: PM Edition 2020-12-08
Bonds rose as expected to test the moving averages before falling back to 172^14.
The Day Ahead: AM Edition 2020-12-08
Bonds on forecast with the climb today.
First Look: 2020-12-08
S&P 500 futures have dropped overnight under 3677.25, a negative, but recovered after testing support at 3663.25.
The Day Ahead: PM Edition 2020-12-07
Bonds took the first steps to dig out of the hole from Friday by recovering 172^14.
The Day Ahead: AM Edition 2020-12-07
Bonds working on a bounce as expected this morning.
First Look: 2020-12-07
S&P 500 futures are up overnight after testing support at 3673-77.
The Day Ahead: AM Edition 2020-12-04
Bonds didn't react well to the morning news today rejecting 173^03 and dropping to a new low under that of two days ago.
First Look: 2020-12-04
S&P 500 futures held up overnight and reasonably well after the NFP number this morning.
The Day Ahead: PM Edition 2020-12-03
Bonds doing well today as the form a base over 182^14.
The Day Ahead: AM Edition 2020-12-03
Bonds have been building a base above 171^26 which is certainly constructive.
First Look: 2020-02-03
S&P 500 futures have held up pretty well overnight.
The Day Ahead: PM Edition 2020-12-02
Bonds spiked down today to test the next support at 171^26 and then bounced.
The Day Ahead: AM Edition 2020-12-02
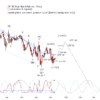
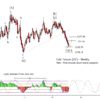
Bonds look like they have a completed five wave move down from the November 30th lower high which is the correct form for C of (B) of [II].
First Look: 2020-12-02
S&P 500 futures have mostly been sideways overnight trying to hold support at 3645.50.
The Day Ahead: PM Edition 2020-12-01
Bonds certainly had a weak day though this is what I had in mind for a better (B) wave candidate.
The Day Ahead: AM Edition 2020-12-01
My suspicion that bonds may need to drop a bit more has proven to be correct with the sharp move lower this morning after breaking under minor support at 174^08.
First Look: 2020-12-01
S&P 500 future rose overnight which is consistent with the near term bullish forecast.
The Day Ahead: PM Edition 2020-11-30
Bonds are trapped between resist at 175^08 and the moving averages at 174^03.
The Day Ahead: AM Edition 2020-11-30
Still remain skeptical that the small corrective low is set in bonds hence am open to a drift lower to test 174^08 or 173^18 over the next day or two.
First Look: 2020-11-30
S&P 500 futures started out strong on the Sunday open but then retreated into the early morning today.
The Day Ahead: AM Edition 2020-11-27
Bonds about in the same place as they were on Wednesday.
Weekly updates & other posts
(Public posts are included on this page too.)
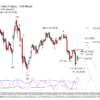
The Week Ahead 2018-10-21
The scheduled economic news is heavily weighted toward the middle to the end of the week with US New home sales Wednesday, the ECB press conference Thursday morning along with US Durable goods orders, and US GDP on Friday.

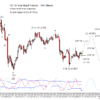
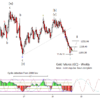
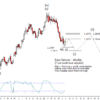
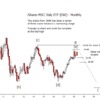
A warning to crude oil bulls
The last high was probably an overshoot
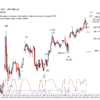
The Week Ahead 2018-10-14
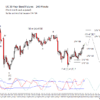
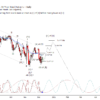
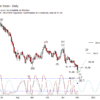
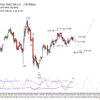
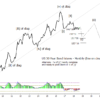
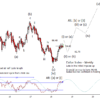
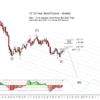
Before looking at bonds, here is a chart of the 30 year Treasury yield. Yield has broken above the long enduring channel. The next cycle inflection is March of next year which suggests this break has several more months to run.
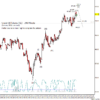
The Week Ahead 2018-10-07
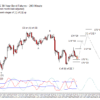
Bonds extended lower last week have breaking under a series of prior lower. I'd like to see support form from a little lower and bounce retest the break before continuing lower.
The Week Ahead 2018-10-01
The week will start of dominated by exuberance that the trade agreement with Canada and Mexico got ironed out. Plenty of economic data this week with the high point being the NFP on Friday. That means there is plenty of news that can be used to move the markets around. On to the charts.

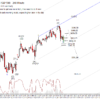
Russell 2000 ETF still reaching for higher targets
Consider a "base hits" trading approach now
The Week Ahead 2018-09-23
To summarize expectations over the next three to six months: Bonds accelerate lower into spring of next year, US equities in a topping phase starting now and lasting as late as early next year, Dollar Index stronger in the period, Euro weaker, and gold net lower but should have a correction sideways to higher in the period. Let us move into the weekly charts.
The Week Ahead 2018-09-17
I'm going to do this post a little differently than I have been in the past. I have been requested to formulate my thoughts on the big picture and what may take place over several time periods, three, six, nine months and more into the future. I won't address that fully in this post, but later when I think more on it and prepare some charts but will mention ideas for where things could be in the three to six month window.

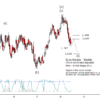
Treasuries Consolidating Beneath Broken Support
Stepping stone levels to watch during the decline
The Week Ahead 2018-09-09
Bonds appear to be dropping from a completed wave (ii). We will have more confidence in that hypothesis once under 142^03.
The Week Ahead 2018-09-03
Hope you all are enjoying the last long weekend of the summer. This next week will see people getting settled in and back to work.

Copper mining fund points downward
Here are some potential entry areas
The Week Ahead 2018-08-26
The main count in bonds is the 1-2,1-2 type count where prices break lower from near here in wave (iii). Next week is the half way point from the cycle low to the next projected high, a good point to look to see if prices are going to use the cycle inflections in a low to low fashion.

Bearish prospects for copper
But manage your short positions now
Copper Update (Futures and a mining ETF)
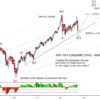
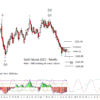
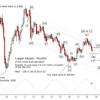
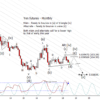
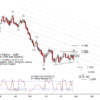
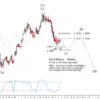
I relatively recently updated the copper futures charts as requested by a subscriber. At that time, my view was that copper was moving down in the last leg of wave (a) down from the high from late last year. I now think that (a) may be complete and ready to embark on a few months of choppy retrace up. Below you will find monthly and weekly copper futures charts and also monthly and weekly charts of a copper mining ETF (COPX).
The Week Ahead 2018-08-19
Bonds may make a deeper correction up over that of current prices but not required as on a lower time frame there is resist being tested now. That resist has caused a doji to form on the weekly bar last week.
The Week Ahead 2018-08-12
The strength of the move up in bonds last week argues that the alternate count from last week, where a 'b' wave low was being set, is in fact playing out. That means there should be more to the rally for the next couple weeks to test 146^18 or 147^25.

Yen futures setting up for a bounce
There's a line the trade should not cross
The Week Ahead 2018-08-05
As I mentioned last week, it does bother me that shorting bonds is a popular trade but that is normal for a third wave. If bonds fail to drop under the May low in the next couple months, than the alternate count is in force and can result in a bounce into the end of the year.
Copper Futures Update
By request, refreshing the copper analysis. Copper has been falling in line with the forecast from late last year. I think this is probably the first move down in wave [b] or [ii].
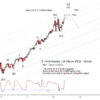
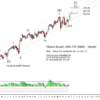
E-mini Nasdaq 100 futures
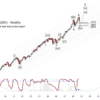
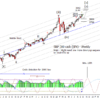
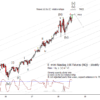
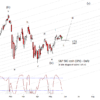
The upward form up from 2016 and 2009 in NQ should nearly be complete. The question now is if the impulse up from the consolidation early this year is complete. I'd say the minimum requirements are now met at the last high in late July. Following is the weekly chart. I will add two different daily charts later that address two possibilities, a simple impulse up and an ending diagonal. When I add the daily charts, I'll add a note to the top of the post to notify you.
Yen Futures Update
I have reworked my EW count in the Yen to be that of a triangle wave [iv] that needs one more wave up in (e) to complete. The alternate is that wave [iv] was set early this year and prices are set to bounce in wave (ii) of an ending diagonal [v].
The Week Ahead 2018-07-29
This week is busy on the scheduled economic news front with emphasis on the FOMC on Wednesday afternoon and the NFP Friday morning.
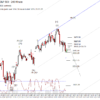
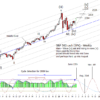
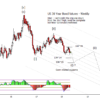
iShares 20+ Treasury Bond ETF (TLT)
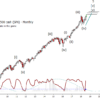
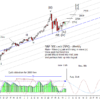
TLT has been trading in a tight range for the last several months, making short stabs at breaking lower but finding support at tests of prior swing lows. I lean to support failing over the next several months and pushing for a rough support area of 112.00 to 110.

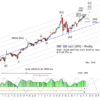
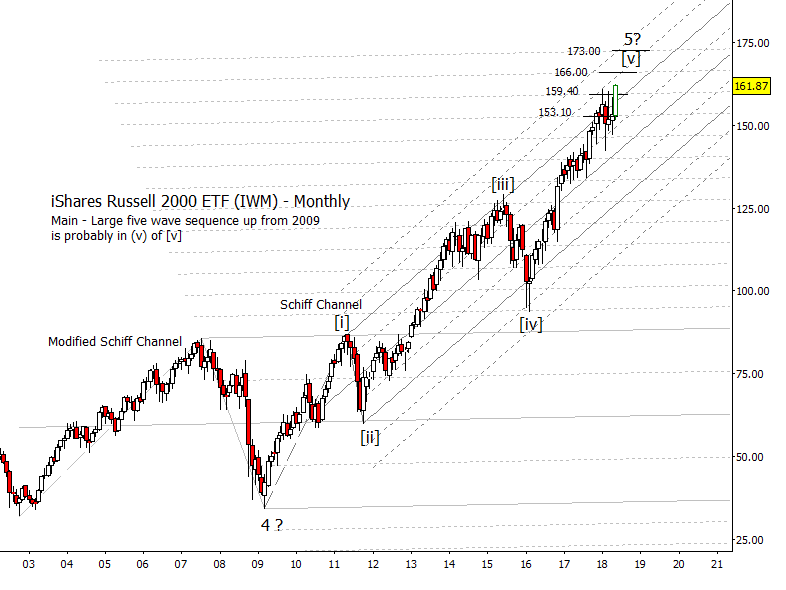
Russell 2000 ETF (IWM) Update
The Russell 2000 ETF (IWM) is very late in the advance from the 2016 and likely the 2009 low as well. It is aggressive to sell to short but certainly makes sense to lock in profits especially if you went long or added in the consolidation earlier this year.

Time to cash out on your currency trades?
Dollar chart says manage your positions
The Week Ahead 2018-07-22
If bonds are down in a third wave lower, bond prices should be heavy into the end of the year and take a shot at a new low for the year. If the alternate is in force, prices will stabilize above the low of the year and bounce into wave (ii) resistance again late in the year. Put another way, the question at hand is if the dominant cycle inverts and results in lower prices at the end of the year or if the polarity stays intact and drags bond prices up after a short term, several weeks to a couple month, pullback. I lean toward the former over the latter. We will see what it looks like in late September or October.

Signs that NASDAQ could rally higher
But the larger rally is nearly complete
The Week Ahead 2018-07-15
For the last couple weeks I have been looking for a reversal lower in bonds but I am begging to wonder if they hold or even rise a bit more into the next FOMC meeting which is August 1st. My preferred scenario is one where the dominant cycle inverts and leads to a move lower into the end of the year.
Bearish trades to watch with the Euro
with a focus on entry areas
The Week Ahead 2018-07-08
Weekly bonds tested the 146^27 resistance level last week while the weekly dominant cycle is signaling a possible inflection and the adaptive CCI is about to have a zero line test. All the above suggest that the move up from May is in danger of ending soon and resuming the trend lower. The alternate is that this bounce is only the first wave up in (ii) and will become more complex later in the year retesting resistance after moving down for a month or two.
The Week Ahead 2018-07-01
Changing up the order I look at charts to an alphabetical order to optimize my workflow just a bit. Don't worry, we will get the S&P 500, it will just be at the end.
S&P 500 Intraday Update
Here is a brief intraday update on the progress of the S&P 500 intraday since the Slack service that we use for the live chat is having connection problems this morning.
The Week Ahead 2018-06-24
The grand theme that I have been operating under is that the S&P 500 and US equity indexes in general should have a rise into middle of June at a minimum and perhaps into the next cycle inflection at the end of August. If the S&P 500 had a completed five wave impulse to a test of or new high with this cyclic positioning, I would be claiming a high was being set. The wrinkle in the plan is that we don't have a test of the high nor a very satisfying formation. Up to this point I've been pounding the table for the prospects for higher but I'm going to pull in my horns a bit now. I still think it wise to allow for higher but prudent to manage any long positions you may have. After all, the Russell 2000 and Nasdaq 100 have made new highs over that of early this year and wouldn't be shocking to have intermarket divergences at the top.
The Week Ahead 2018-06-17
The equity markets took the FOMC rate hike well which I consider a positive for eventually getting a test or marginal new high in the S&P500. That said, it is worthwhile noting that the Russell 2000 and Nasdaq 100 have already made new highs over that of January this year satisfying the macro picture for a new high before a more serious correction process to begin. It also would not be shocking to see intermarket divergence where some indices make new highs and others make lower highs right before a serious downturn. Net, I think there is room for the equity market to extend but it is late in the game.

Brazilian stocks can travel lower after a bounce
There should be a trade soon
The Week Ahead 2018-06-11
This week is full of events that could either push the equity markets higher or pull the rug out from under them, the Singapore summit on Tuesday, FOMC on Wednesday, and ECB Thursday morning. My base hypothesis is the wheels will remain on even with a rate hike by the FOMC as long as it is accompanied by language that does not sound too hawkish for further hikes this year.
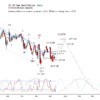
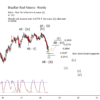
iShares MSCI Brazil Index ETF (EWZ)
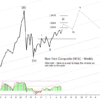
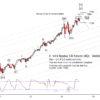
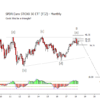
By request, here is a look at the ETF that covers Brazilian equity. Looking at the weekly chart below, you will see that I am calling the move from the 2008 high to the early 2016 low a completed three wave corrective structure. Up from the 2016 low, I think you can call that an impulse up for [i] or [a]. The current swing down this year should only be the first move down in a three wave formation for [ii] or [b]. Prices have bounced from a Gann related support at 31.37 though I favor a test of that low or a new low before the impulse is complete. The idea of a new low in (a) is alive as long a the bounce stays under Fib resists at 35.16 and 37.62.
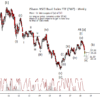
Brazilian Real Futures
I've been asked to look at Brazilian equities and will do so over the weekend, but thought some of you may find this interesting to tide you over till then. I had been working on this since it has been in the news. The Brazilian Real has been bouncing today off of support today. I don't know if the bounce will end up being a wave (ii) or (iv) as I can argue for either but certainly think it isn't something to short until up against 0.2775.

British Pound following the downward plan
We show where to look for the trades

Crude oil ETF retrace may have begun
It should cut into the year-long advance
The Week Ahead 2018-06-03
The S&P 500 dropped a bit lower at the beginning of last week to test the broken trend line and climbed up out of the hole the rest of the week. I see this as a positive development that should result in prices moving upward this week to new post May 4th highs. The main theme is higher into the middle of this month to the next FOMC meeting. Next goal should be to aim for 2794 SPX.
British Pound Futures and ETF Update
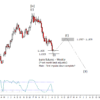
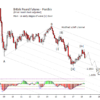
Primary view is that GBP futures are in the first stages of a move that should test or exceed the 2017 low. A monthly chart for perspective is below.

Italian stocks poised for reversal
A downward break out of a decade-long triangle
The Week Ahead 2018-05-28
The rest of this holiday is shortened week is filled with a fair amount of scheduled economic news with the NFP on Friday morning as the main event. The primary scenario in the S&P 500 is to see a break up out of the sideways formation of the last few weeks into the middle of next month.

Russell ETF rises toward next targets
IWM is rising as expected. Here are some target zones where the move might end.
The Week Ahead 2018-05-20
Starting the weekly post with some musings on two ETFs that cover large cap European equities, the SPDR Euro Stoxx 50 ETF (FEZ), and the iShares MSCI EMU ETF (EZU). FEZ is the narrower of the two in that it is only the 50 of the biggest companies in Europe and EMU a more broad selection of large cap but there is obviously a lot of overlap between the two. They both paint a picture that says that valuations of large cap in Europe have not fully recovered from the 2007 financial crises and that they are late in their bounces, in fact, I think you can make a case for European large cap may be over. I'm open to the idea of these beginning to roll over and the US equity indices continue on to a new high later in the year.
MSCI Italy ETF EWI Update
Since Italy has been in the news lately by finally getting a coalition government formed, I thought it a good time to peek at the ETF covering the Italian equity market. As last time I updated this, it still looks like a decade long triangle either finished or nearly so.
Russell 2000 via ETF IWM Update
I know you have had to endure my cautious optimism over the past three months where I have focused on finding lows versus pounding the table to sell on highs but it has borne fruit in Russell 2000 and its corresponding ETF IWM which has pushed to a new high over that of January this year. While I expect it to attempt to reach higher into at least next month if not into August, it is wise to begin to lock in some profit by some combination of raising stops or taking partial profits on this new high. Next harmonic of the wide base channel is at 166.00.
The Week Ahead 2018-05-13
We have had a second solid week up in the US equity indices since the last test of critical support. The fast dominant cycle is in an up phase into middle of next month which supports the theme that between now and the next FOMC meeting will be a period which the equity indices have the lion share of the gain from the wave (iv) low. I'm a little skeptical they get a new high in by then but neither is it impossible. I still favor the equity indices holding up into the next cycle inflection in late August.