My premium content
Morning & evening updates
We chart the S&P 500, crude oil, the Euro, Dollar Index, treasury bonds, and gold, typically with a morning and evening post for every trading day.
The Day Ahead: AM Edition 2020-12-29
Bonds trying to wake up again as they are above 172^18 which is a positive in the short term.
First Look: 2020-12-29
S&P 500 futures are up again overnight and thus see that as on plan.
The Day Ahead: PM Edition 2020-12-28
Bonds dipped today to retest 171^29 but quickly recovered 172^14.
The Day Ahead: AM Edition 2020-12-28
Considering that equities have pushed to a new high, I give bonds props for trying to hold up.
First Look: 2020-12-28
S&P 500 futures are up in accord with the latest musing in the chat room.
The Day Ahead: AM Edition 2020-12-24
Bonds had a nice move up from 171^17 and have recovered 172^12.
First Look: 2020-12-24
Not really much difference in my view on S&P 500 futures than from yesterday.
The Day Ahead: PM Edition 2020-12-23
Another day where bonds rejected the daily moving averages and pushed lower though not able to make a new swing low.
The Day Ahead: AM Edition 2020-12-23
Bonds fell away again from resist at 173^15 and broke support at 172^12.
First Look: 2020-12-23
S&P futures took a dip after the close yesterday but have recovered all that drop in the European morning.
The Day Ahead: PM Edition 2020-12-22
I've been stubborn about bonds firming up and eventually pushing over 174^03 for the last two weeks.
The Day Ahead: AM Edition 2020-12-22
Bonds still struggling but are holding 172^12.
First Look: 2020-12-22
S&P 500 futures traded sideway to up overnight.
The Day Ahead: PM Edition 2020-12-21
I'm a bit perplexed by the short term pattern in bonds.
The Day Ahead: AM Edition 2020-12-21
Bonds rejected 173^15 this morning which is a setback for a short term bullish outlook.
First Look: 2020-12-21
S&P 500 futures made a quick new high on the Sunday evening open and then started moving lower.
The Day Ahead: AM Edition 2020-12-18
Bonds are still sluggish and it is true that it is a minor negative the they are under 172^27.
First Look: 2020-12-18
S&P 500 futures almost made it to the 3726.25 target in the early morning and has been falling since then.
The Day Ahead: PM Edition 2020-12-17
Bonds have mostly traveled sideways the last few days just under the moving averages.
The Day Ahead: AM Edition 2020-12-17
Bonds finally getting a foothold after the dips down that occurred yesterday.
First Look: 2020-12-17
The S&P 500 futures are up overnight as expected. This rise technically completes the form for the diagonal.
The Day Ahead: PM Edition 2020-12-16
Bonds doing everything they can to shake off those looking for a better bounce.
The Day Ahead: AM Edition 2020-12-16
Bonds appear to have elected to form a complex corrective formation with the initial softness this morning with the test of 172^01.
First Look: 2020-12-16
S&P 500 futures did move higher overnight as expected but working on a correction in the day session morning.
The Day Ahead: PM Edition 2020-12-15
Bonds still having a tough time with the resist from 173^19 to 174^03.
The Day Ahead: AM Edition 2020-12-15
The good news for bond bulls is that 173^30 was tested.
First Look: 2020-12-15
Since S&P 500 futures held the support it had to overnight to enable a new high in the last wave of an ending diagonal.
The Day Ahead: PM Edition 2020-12-14
Bonds had a quick dip today but did recover the drop and now just under the high from Friday.
The Day Ahead: AM Edition 2020-12-14
Bonds started the day soft but have been climbing steadily from support at 172^15.
First Look: 2020-12-14
S&P 500 futures gapped up on Sunday evening and have creeped higher since then.
Weekly updates & other posts
(Public posts are included on this page too.)

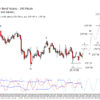
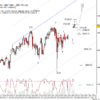
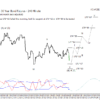
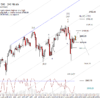
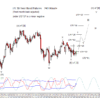
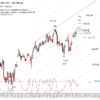
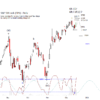
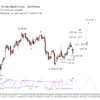
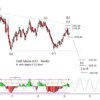
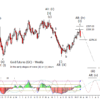
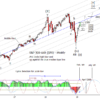
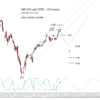
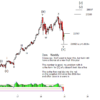
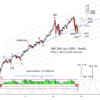
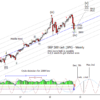
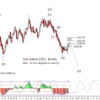
Gold ETF ready for breakout move
Our main scenario is bearish, but there's an alternate too
The Week Ahead: 2019-03-31
Bonds appear ready to enter a couple weeks of correction before rising in one last impulse to finish (c) of [ii] up.
The Week Ahead 2019-03-25
I've decided to relent and move (b) to the low of the three month consolidation in bonds and thus looking higher for (c) of [ii]. The next ideal cycle inflection is April 12th so plenty of time for (c) to stretch a bit higher.
The Week Ahead 2019-03-17
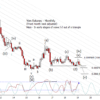
I still like the idea that the (a) wave up in the bonds off the low is in but can live with 'b of (b)' testing or even exceeding the high as an alternate. I have included the monthly line on close chart to put things in perspective.

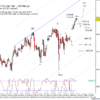
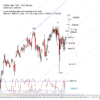
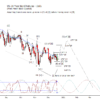
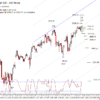
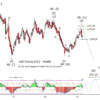
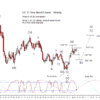
Yen ready to break out of range
This spring might see a downward cascade
The Week Ahead 2019-03-10
I've stared at the bonds charts on and off for a few hours and is slowing me up getting this post off the ground. Maybe I should just put my thoughts to bits and explain what I have been thinking about.
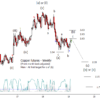
Copper Update 2019-03-10
Quick update on copper. Copper has softened against resist and either set a (b) wave high or 'a of a more complex (b)'. Looking at a daily chart there is some wiggle room for a modest new high in the short term if they react strongly to support at 2.88. I have also included a chart of the copper mining ETF COPX so as to have a visual of the possible complex (b) wave alternate.
Natural Gas via UNG 2019-03-10
Back when I last updated UNG charts, I thought a bounce was due and in fact one has taken place. The question now is, was the low in February the end of the pattern down from the November high from last year or is there one more low left? I favor the latter because fourth waves typically have a complex wave form and we have yet to a new low or test of the 2017 low. For timing, thinking the best time for a low is late March or early April, even it turns out to be a higher low.
The Week Ahead 2019-03-03
Bonds are closing in on a (b) wave low over the next few weeks. There may be a short term bounce against 143^20 but as long as bond prices remain under 144^31 prefer lower to the next weekly support at 142^01 or a daily target of 141^30.
Yen Futures & Yen ETF FXY 2019-03-03
When I last posted charts on Japanese Yen, I was looking for a bounce up from a possible (d) wave low of a triangle [iv]. It looks like the last wave of that triangle, wave (e), completed at the start of this year. Cycles suggest wave [v] down is in progress and could last till August of this year
The Week Ahead 2019-02-24
Bonds should at least eventually retest 143^30 before advancing in the third part of a wave [II] later this year. In the shorter term, it is not clear if 'b of (b)' is complete as there was a bounce...
Copper Update: 2019-02-22
In the short term copper has advanced as I laid out in the last daily chart though reaching initial short term targets now so I thought I would give an update. Big picture, this is either working on a (b) wave or the first step up in a (b) wave depending on where you place the (a) wave low.

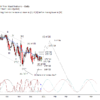
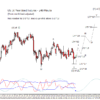
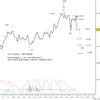
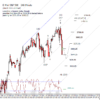
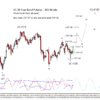
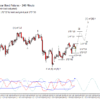
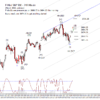
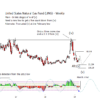
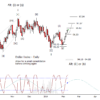
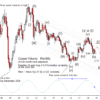
Which resistance line will put a lid on the copper bounce?
We expect a reversal
The Week Ahead: 2019-02-18
Not much change in bonds. Looks like the 'b of (b)' is still in development. Thinking it best to allow for 147^22 to be tested this week. If at the end of the week bonds are still held back by 147^02, then that might be it.
Copper Update 2019-02-17
Since the middle of last year, my view has been that copper needs to bounce in a (b) wave as preparation for rolling down again in a (c) wave. Copper is now at an initial target for 'c of (b)' at 2.85. When dropping down to a daily chart, you can make a case for a little push up for one more wave up so as to get a five count up from the early January low. Once copper does roll lower, if it makes a higher low to the 2016 low, it will qualify as both a wave [b] or [ii]. If it eventually makes a new low to the 2016 low, it will be valid as a [b] wave low.

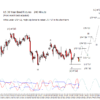
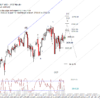
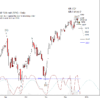
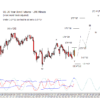
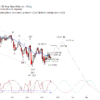
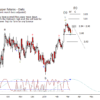
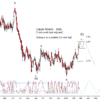
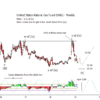
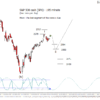
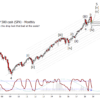
Natural gas preparing to lift
It might be making a durable low

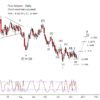
Is the Euro getting ready to fold?
The latest bounce retrace was very weak
The Week Ahead 2019-02-10
The 'b of (b)' in bonds is still developing as bonds were unable to break under the daily moving averages early last week. The overall plan is to get a choppy retrace from the high early in January to next month or early April before advancing again into July for a wave [ii].
Natural Gas via UNG Update
When I last posted a UNG chart about two weeks ago, my assumption was that a wave iv bounce was forming against 30.08. As it turns out, that resist was not challenged again and prices have continued to fall. That said, I think it might be jumping the gun to say that UNG is now down in 'v of (iv)' though that is the alternate. The primary I am running with is that this drop is '[B] of iv' and due soon for a move up in '[C] of iv'. Targets for iv are at 26.71 and 29.13. As for timing, beginning to mid April looks appealing for the 'v of (v)' low. Weekly and daily charts below.
The Week Ahead: 2019-02-03
A case can be made that bonds have completed 'b of (b)' and now ready to decline in 'c of (b)'.

Brazilian stocks climbed 40% off our support
What comes next after that 3-wave move?
The Week Ahead 2019-01-27
Bonds are about halfway in the development of a (b) wave down from the (a) wave high at the start of the year. I expect (b) to be a complex choppy formation. In the short term bonds can trade a little lower but overall thinking somewhat sideways into mid February.

British Pound getting ready to resume its decline
Two resistance zones to watch

Big-picture forecast for the Dollar ETF
Ready for launch?
The Week Ahead 2019-01-20
Monday is a US holiday thus will not post in the morning though will post daily charts in the late afternoon/early evening. Also had a request to follow natural gas again which I will do, posting on it once a month.

Italian stocks may need to climb a little
Time for bears to manage positions
The Week Ahead 2019-01-13
The fast dominant cycle is at a crest in weekly bonds and prices have been attempting to reject 148^31 for the last two weeks. I can't say it is impossible to retest resist but provisionally calling wave (a) up complete. Next support is at 143^30. I think the next major timing in bonds will be in the summer around July or August so prefer to see several months of choppy movement lower followed by a summer rally to complete (c) of [ii].

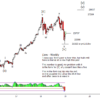
The sun hasn’t set on stock indices quite yet
There's still a bullish count
The Week Ahead 2019-01-06
Bonds tested a Gann related resist this week at 148^31 when both weekly and daily cycles suggest a cycle high making it a candidate for the (a) high that I have been looking for. If wave (a) is in, the retrace in (b) should take the form of a choppy three wave move over the next few months.

What’s next after the Brazilian Real’s nice bounce?
We follow up on our September forecast
The Week Ahead 2018-12-31
The ideal dominant cycle in bonds is topping out this week. I continue to see this as wave (a) of [ii] complete or nearly complete. Crude is in a tough spot here. Certainly it is deeply oversold and...
The Week Ahead: 2018-12-23
Monday has an early close and Tuesday is closed for the holiday. Imagine that volume is thin till the first full week in January as many take time off till then.

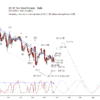
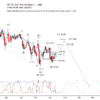
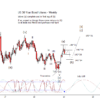
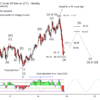
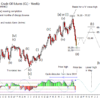
Crude oil decline is overextended
Watch for a countertrend swing
The Week Ahead 2018-12-17
The defining item this week will be the FOMC statement and press conference on Wednesday as traders look for clues of a halt to the rate hikes in 2019.
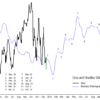
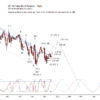
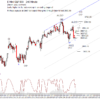
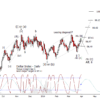
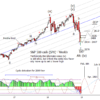
Bradley Siderograph – Late 2018 into 2019
The Bradley Siderograph is timing model for stock market turns that while no means perfect is worth keeping an eye on. Main interest is in the inflection points on the graph, not the direction or magnitude of change. An example of this is that the May 23rd 2018 swing in the Bradley was the biggest swing in the graph but was weak but the next tiny inflection at the end of June resulted in a major low in equity prices and big rally. Below you will see a chart with the Dow and Bradley model with dates of the next inflections out into fall of next year. Of note is then next two, December 20th and January 16th, of which I think December 20th is more important since it is a day after the next FOMC meeting.
The Week Ahead Addendum 2018-12-10
I neglected to add crude charts to the Week Ahead post. Correcting that here.
The Week Ahead 2018-12-09
Possibly an exciting start to the week in equities this week as we find out if the major supports fail. Not looking good as I type as S&P 500 futures are down 20 points but I don't like to read too much into Asian session Globex. In addition to the US and China tensions we have the ECB on Thursday morning along with contract roll.
The Week Ahead 2018-12-02
I'm adding the daily charts to the usual weekly charts this week. Might turn into the new normal instead of a post of daily charts late Friday or Saturday. The main event for the start of the week is reaction to the favorable trade news from the G20. S&P futures are up 46 points as I type. More than I would have guessed but consistent with one of the options talked about in chat late Friday. Equity markets will be closed on Wednesday. NFP on Friday morning.
The Week Ahead 2018-11-26
Regardless whether the nearly two month consolidation in bonds is a wave [IV] or wave ii, I still think bonds should roll lower in December. Bond prices traded in a pretty narrow range last week against resist at 140^11. It is a near term negative for my bearish forecast that the weekly cycles point toward a late December inflection point.

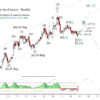
Crude oil fell, as ordered
The ETF dropped when it reached the right altitude
The Week Ahead 2018-11-18
Bonds have been consolidating under prior lows stretching back to 2016 for over a month now. I still favor net lower into March of next year but acknowledge that daily and weekly cycles are working against each other which helps account for this stall. I'd rather prices not poke much above 139^26 but anyone searching for a short is better off waiting for some confirmation first as they may poke up briefly to run stops before resuming lower.

More decline ahead for copper mining fund
Bears need to wait for it to reset first
The Week Ahead 2018-11-11
Bonds continue to consolidate after having punched under the group of prior lows stretching back into late 2016. I score that as negative in the medium term for bond prices and thus favor lower till at least a new low is made under that of October 12th. At that point we will see if they wish to use the last five weeks of consolidation as a wave ii, as shown on the chart, or a small degree wave four which will then trigger a wave two bounce that again retests the break around 139^26. As far as timing is concerned, I think the next major point is either March or May of next year which leaves us in a conundrum as to whether we fall or rise into said area, or perhaps get some frequency doubling that that allow for more than one change in trend. I'm leaning lower since we are under the prior lows but won't be stubborn about it if they firm up on a new low in December.
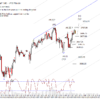
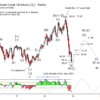
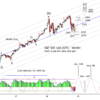
Copper Futures and Copper Miners ETF Update
Starting with the copper monthly chart for perspective. Primary thesis is that a large corrective formation completed at the 2016 low and that the climb up to the late 2017 high was the first impulse up from that low. That implies a corrective move lower and my assertion is that copper completed the first move of that correction in the summer of this year and due for a consolidative bounce before dropping in the last leg of the larger correction. I have penciled in the next corrective low to coincide with a cycle low middle of next year at a higher low to that of the 2016 low though a new price extreme in [b] would not break the pattern.
The Week Ahead 2018-11-05
Pretty eventful week coming up with ISM non-manufacturing PMI at 10:00 on Monday, US midterm elections on Tuesday, and the FOMC November meeting statement on Thursday at 14:00. I think there may be some room for US equity markets to bounce a little more Monday morning but wouldn't be surprised if selling comes in later in the day and Tuesday on some election nervousness. Overall, thinking equity can head higher later in the week but that is probably getting to far ahead of the game as will have to see how they behave overnight Tuesday and into Wednesday morning.

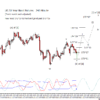
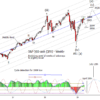
Dollar Index At Important Juncture
Does it need to test support again?
The Week Ahead 2018-10-28
Bonds have bounced to retest the prior break lower. Below I have added both of the ideas I am working with. Both imply lower into at least December and I wouldn't be surprised if it extended into March. The difference between both ideas is how much bounce takes place once the next low is set. The first would only result in a weak sidewise move versus the second which would bounce higher, perhaps near the 150 handle.

Will stocks or bonds stumble first?
One of them is likely to recover its footing
S&P 500 Update
As I have been looking at this in the morning, I have talked myself into this possibility which would imply the low was set yesterday and now in a rally off that low. Selling resistance at 2794 or 2707 is fair, but be prepared to not get a new low on the day out of it.

An avoidable mistake for equity bears
Don't jump in at the point of maximum fear