My premium content
Morning & evening updates
We chart the S&P 500, crude oil, the Euro, Dollar Index, treasury bonds, and gold, typically with a morning and evening post for every trading day.
First Look: 2020-11-27
Bias is usually higher on the partial day after Thanksgiving.
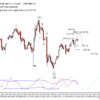
The Day Ahead: PM Edition 2020-11-25
Bonds didn't do much today which is hardly surprising a day before a holiday.
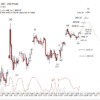
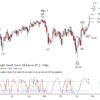
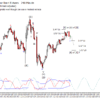
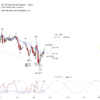
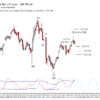
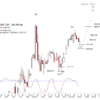
The Day Ahead: AM Edition 2020-11-25
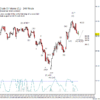
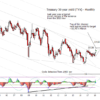
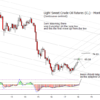
Bonds are attempting to bounce from support at 176^16 but my conviction that wave (B) is set is low.
First Look: 2020-11-25
S&P 500 futures came through with the last little push into upper resist after the New York close yesterday and has spent the evening and early morning drifting back.
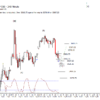
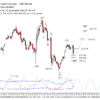
The Day Ahead: PM Edition 2020-11-24
Bonds did a decent job dropping the expected retrace of the advance from the November low to the high late last week.
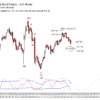
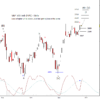
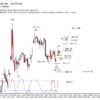
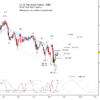
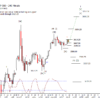
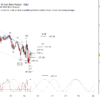
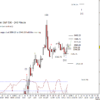
The Day Ahead: AM Edition 2020-11-24
Bonds have continued lower on plan but now nearing a more reasonable target for (B) of [II] at 172^16.
First Look: 2020-11-24
Nice to see S&P 500 futures up overnight which indicates the forecast is on track.
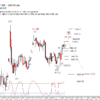
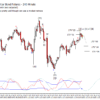
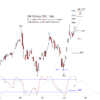
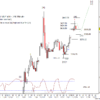
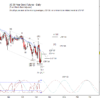
The Day Ahead: PM Edition 2020-11-23
Bonds started to slip back away from resist at 174^03 today.
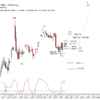
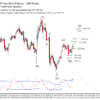
The Day Ahead: AM Edition 2020-11-23
Bonds are slipping back a bit which was expected.
First Look: 2020-11-23
S&P 500 futures rose on the Sunday evening open into the early morning today.
The Day Ahead: AM Edition 2020-11-20
Bonds have certainly been resilient but I think it best to allow for a modest retrace before another advance.
First Look: 2020-11-20
S&P 500 futures should net rise today aside from a possible stutter in the morning.
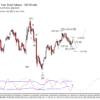
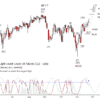
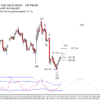
The Day Ahead: PM Edition 2020-11-19
The bond bounce up has proven to be more resilient than I had expected and is up to the minimum retrace for a possible wave [II].
The Day Ahead: AM Edition 2020-11-19
Bonds are being pretty resilient and refusing to stay down.
First Look: 2020-11-19
The S&P 500 futures have dropped a little under the day session close and recovered a bit early this morning.
The Day Ahead: PM Edition 2020-11-18
Bonds did poke a little higher today to test resist at 173^07 before falling back to the moving averages.
The Day Ahead: AM Edition 2020-11-18
Bonds look like they can head lower for a bit.
First Look: 2020-11-18
S&P 500 futures started off soft after the close yesterday retesting support then rose throughout the early morning.
The Day Ahead: PM Edition 2020-11-17
Bonds rose today after testing the 171^08 support yesterday and are pressing up into the daily moving averages.
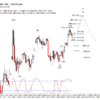
The Day Ahead: AM Edition 2020-11-17
Bonds are up this morning though so far only a three wave move up from the 171^10 support.
First Look: 2020-11-17
It took the evening and early morning globex trade to do it, but S&P 500 futures finally fell back into support for a fourth wave.
The Day Ahead: PM Edition 2020-11-16
Bonds fell back from a tap of the daily moving averages today which is expected behavior.
The Day Ahead: AM Edition 2020-11-16
Bonds have slipped back this morning to test a short term support at 171^10.
First Look: 2020-11-16
More positive vaccine news has pushed the S&P 500 futures higher early this morning.
The Day Ahead: AM Edition 2020-11-13
Bonds are in a minor consolidation this morning but I think there is a good chance to get one more minor press up before wave (A) is complete.
First Look: 2020-11-13
Pretty happy with the rise in S&P 500 futures overnight from the afternoon low from yesterday.
The Day Ahead: PM Edition 2020-11-12
Bonds had a big day today rising up and surpassing both intraday and daily initial targets.
The Day Ahead: AM Edition 2020-11-12
Bonds have continued the bounce higher this morning but approaching resist at 171^21.
First Look: 2020-11-12
Yes, S&P 500 futures fell overnight to poke under support at 3545.00 but they did recover hence making it difficult for me to be bearish today while above 3545.00.
The Day Ahead: PM Edition 2020-11-11
Bond briefly poked lower to test the 169^17 support than spent the day rising.
Weekly updates & other posts
(Public posts are included on this page too.)
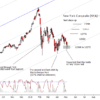
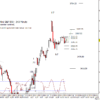
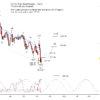
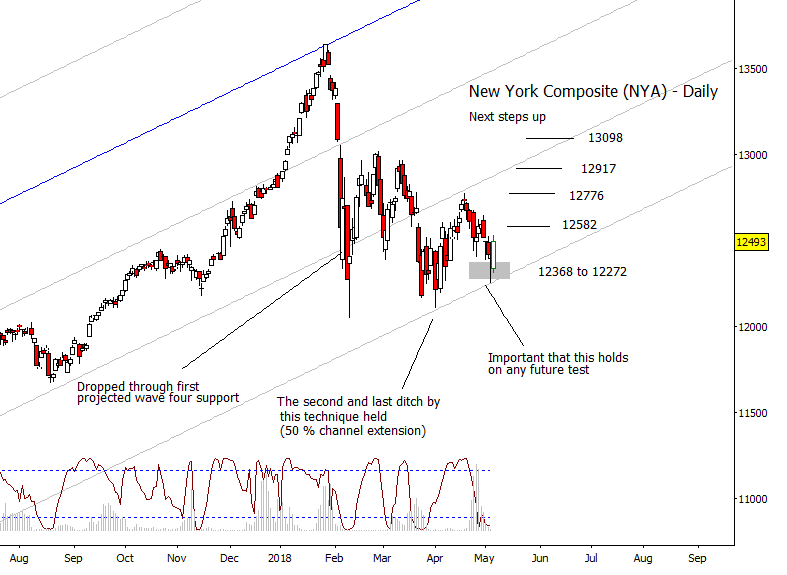
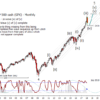
The Week Ahead 2018-05-06
I think the main event that took place last week for the US equity indices was that the 50% extension of the channel in the New York Composite held. The low last week is a good candidate for a wave (iv) low and now looking for a rise for the next month at a minimum if not into the summer. I'd like to see a new high but I can live with a truncation or intermarket divergences. This week, the goal is to not give up much of the gain from last Friday and attack the April high.

Aussie Dollar ETF resuming down phase
It appears to be breaking beneath support
US Dollar ETF attempting break out
Bullish scenario is kicking in
The Week Ahead 2018-04-29
This week will be heavy on economic data with the standout items being the FOMC statement Wednesday afternoon and the NFP Friday morning. Because of this, I am thinking the easiest gains on the week will be early, Monday and Tuesday. Wednesday afternoon and/or Thursday might turn into a type of consolidation waiting for the Friday news.
The Week Ahead 2018-04-22
I want to start with the Dollar Index this week as I think it is on the verge of poking over 90.51 causing a decent amount of short covering to kick in and the monthly and weekly dominant cycles should help it along. Worth noting that the ECB press conference is Thursday morning so no doubt could function as a catalyst to get this started. Monthly and weekly charts below.
The Week Ahead 2018-04-15
I did a little work on the big picture in the QQQ's, the ETF for the Nasdaq 100 index, today so that is a good starting off point for this review of the big picture for this week.
The Week Ahead 2018-04-08
US equity indices gave back gains made in the first part of last week at the end on increased tariff rhetoric but held above important areas. I know that it may be frustrating that I am not on the sky is falling bandwagon but I still think there is a good chance that the wave (iv) correction ended and we start a rise from this area for a couple months. Don't get me wrong, I think the market is headed for some very turbulent times but I don't think we have seen the high yet. We will see if they can hold steady at the start of the week and not be shocked by the FOMC minutes Wednesday afternoon.
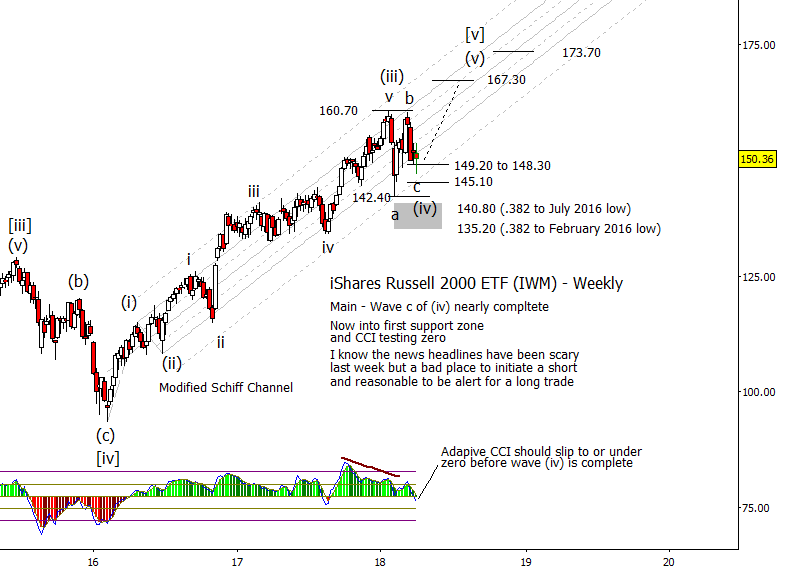
Let's start off with a bonus chart of sorts, a weekly chart of the ETF for the Russell 2000, IWM. It is resting on the top of the wave (iv) target area now and has the adaptive CCI positioned at a zero line test.

Yen at top of retrace
Two ways a decline might play out

Russell 2000: bulls should come back in soon
4th wave correction nearly complete
The Week Ahead 2018-04-01
The S&P 500 held important support last week from both a typical 'c' wave target and a trend line that has proven to be important over the last couple years. If that area holds till the NFP on Friday, the odds that wave 'c of (iv)' has been set go way up. One thing of interest on the weekly chart below is that the adaptive CCI is nearing zero after an extended time above it, which is typical fourth wave behavior.
The Week Ahead 2018-03-25
The 'c of (iv)' in the US equity indexes is well underway and can complete in the holiday shortened week.

Ending diagonal patterns
An ending diagonal pattern is a type of consolidation that can occur at the completion of a strong move.
The Week Ahead 2018-03-18
The main event for news this week is the FOMC rate decision on Wednesday at 14:00 followed by the press conference at 14:30. It is typical for the equity markets to rise into the FOMC meetings thus that will be the main game plan going into middle of the week. It is possible that the 'b of (iv)' has been set in SPX last week but still think we see a modest high over that of last week.
Crude Oil and ETF USO Update
I was working on the ETF that tracks crude oil, (USO), and have decided to promote what I had as an alternate count in crude to the primary, that there is one more high needed to complete a five wave sequence up from the low from last year.
Impulsive patterns
Impulsive patterns are one of the basic components of Elliott wave charts. They always consist of five waves.
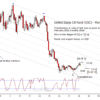
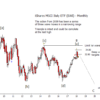
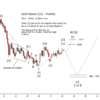
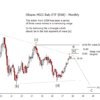
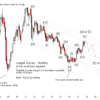
Dollar Index monthly/weekly Update
The main hypothesis is that the DX rise up from 2008 is not yet complete and can accommodate at least one more high over that of the 2017 high. Why do I push back on the idea of a DX high being in and the first impulse down complete or nearly so? Two reasons. One, the move up from the May 2016 low does not look like a well formed impulse but more like a three which is more consistent with a (b) wave high. Two, both monthly and weekly cycles suggest a pretty significant low and a into 2019-2020. I'll even add a third, that the correction from 2012 to 2014 lasted 22 months, and the correction from the 2015 high marked [iii], to the low last months was 35 months, about as close as you can get to 1.618 expansion in time as you can get thus having price and time pointing to a significant low.
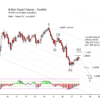
British Pound Update via ETF (FXB)
The British Pound ETF (FXB) is assumed to be forming a wave [iv] like most of the major USD crosses. The move up from the early 2017 low has stalled against a possible wave [iv] target but has not quite pushed low enough to break the uptrend.
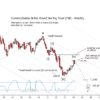
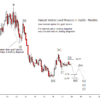
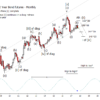
US 30 Year Treasury Yield Update
It is normal that the recent rise is slowing as previous highs are tested but do think we should at least see the channel tested on the monthly chart, around 3.27%, or the first fib extension up at 3.35% is tested before much of a retrace.
iShares MSCI Italy ETF (EWI) update
Since there are elections coming up this weekend in Italy, thought it would be a good time to update the big picture charts for this ETF. I have interest in it as it has formed a classic triangle from the 2009 low and may have completed at the start of this year. I also think it can turn into a canary in the mine, a harbinger for the future.

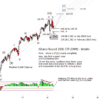
Russell 2000 still has farther to climb
An overall bullish expectation with some targets to watch
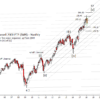
iShares Russell 2000 ETF(IWM) Update
As a continuation of the post yesterday taking a look at the big picture, here is much the same but using the ETF for the Russell 2000 (IWM). The idea expressed here is the same, that we are now in wave (iv) of [v] up from the 2009 low. Expect at least a few months of mostly sideways price action before a push to a new high.
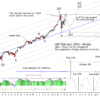
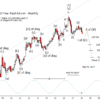
S&P 500 Monthly/Weekly Update
Quite a week in the equity indices last week. Is the end upon us? As you know, my view is no, that we have been expecting a wave (iii) high in the advance up from early 2016 and now should be forming a several month corrective pattern for wave (iv) before an eventual top that should end both the advance from 2016 but also the rise form the 2009 low.
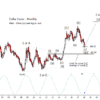
Crude Oil Monthly/Weekly Update
The primary hypothesis in Crude is that the 2017 low was a truncated low and that we are now seeing the first move up out of that low. The next move should be a corrective move lower that last at least until May if not continue into October.
Handy charts — gaps up in indices, Bradley siderograph
Here's a quick reference for Bradley siderograph inflection dates and gaps up in the Dow and SPX
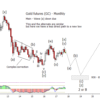
Gold futures monthly/weekly update
In the big picture, either a high is being set soon that results in a significant retrace lower or gold will make a run for mid 1400's if not 1500. Gold has mostly been range bound for the most part of last year and as such I don't see that as terribly bullish. USD has been weak the last year against most crosses and this is the best gold can do?
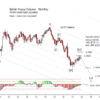
US 30 Year Bond futures update
Bonds are staying on track with the primary forecast of a breakdown out of the ending diagonal that finished in 2016. Best if price pushes under the March 2017 low before much of a bounce.

Watch these supports for your Dollar ETF trades
Both scenarios suggest bullish opportunities in coming months
Updates for US Dollar ETF UUP
With the USD weakness that we have being seeing over the past few weeks, it is a good time to update the monthly and weekly charts on both the main and alternate EW counts on a popular ETF for USD, (UUP).
Will Euro resistance hold?
Bearish scenario still in the lead

Yen ETF preparing for downward breakout
Price is putting stress on a supportive trend line, forcing a squeeze between support and resistance.

Gaps in SPX, Dow — a reference
Here’s a compilation of the open gaps in the S&P 500 and the Dow 30 since last September.

Dollar ETF (UUP) Update
Since I just updated the DX monthly and weekly charts, thought I would plough ahead and update the ETF UUP as well. Same story, expect a wave (iv) has been set and looking for a new high over that of the early 2017 high in the next 18-24 months.
Dollar Index monthly/weekly chart update
Just refreshing the long term charts on the Dollar Index (DX). The forecast is unchanged in that I think that that the Dollar has at least one last high left in it over the next two years.

Gold ETF near a decision point
Right now the bearish case looks best
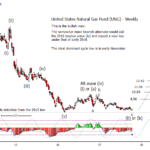
Natural Gas via UNG
UNG, the ETF that tracks natural gas, has elected to take the alternate path from when I last posted these charts by pushing to a new low under that of the 2016 low. The dominant cycle has shifted a...
British Pound futures update
I've been asked for an update on GBP and since the equity indices should quiet down over the next 1.5 hours till the FOMC statement, think I have enough time to get this done. Overall think GBP, like many of the major USD crosses, has spent the last year correcting up in a wave [iv] and should be close to pressing lower in a wave [v] over the next 18 months.

Gold mining ETF offers a better trade than gold
Catching this decline and bounce in stocks might be easier than trading the metal itself.
Gold Miner ETF GDX
I have included charts of this ETF, GDX, in the last couple of gold posts and thought I should make a separate post on it for completeness sake. The main hypothesis shown on the following monthly and weekly charts is pretty similar to that of gold except that I am assuming an ending diagonal here as opposed to a simple impulse lower essentially allowing for a couple retests of the of the early 2016 low before a climb out of the hole.

Reasons to be bearish with Italy ETF
Signs that this triangle pattern can break downward
Gold futures monthly/weekly update
The wave count that I last had on the big picture in gold just didn't sit well with me and have put some thought into it over the weekend. The overall main and alternate ideas in general are the same, it is more of just a technical wave counting issue.
Could Italian equities be the canary in the mine?
I find the iShares MSCI Italy ETF interesting for two reasons. One, so far, it is a textbook example of a triangle formation that has spanned nearly nine years. Two, if the triangle pattern holds and the Italian markets turn down, could that be a precursor to other European equity markets topping and even mark a turning point in the Euro? I don't know if the triangle pattern will hold or if it will be an early warning to other problems on the continent, but it does look like a trading opportunity is nearby.
British Pound futures 2017-11-23
Happy Thanksgiving! I thought I would see if I can sneak in a little analysis before slipping into a turkey induced coma.

Pullback nearly complete with British Pound ETF
We think it's time for the downward trend to resume

Copper ETF poised for downward move
A sizable correction is due
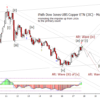
iPath Dow Jones-UBS Copper ETN (JJC)
I went ahead and did the copper analysis for the respective ETN. I've added some additional chart geometry and the Wave 59 9-5 study to the monthly chart but otherwise the story is the same as for copper futures.
Copper futures 2017-11-05
Up until the middle of next last month, I had been treating the rise in copper as a deep wave four but I am promoting the alternate to primary, an initial impulse up from the early 2016 low. That does not mean that I changed my mind about this advance ending, but that I have thrown in the towel on expecting a new low on a turn lower.
Gold futures 2017-10-31
I have been putting off a bigger picture gold post as I have been reevaluating the big picture EW counts. Let me start with the two scenarios I had been using and move on from there.
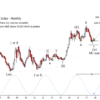
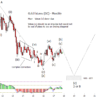
US 30 Year Bond futures 2017-10-22
The bond charts look favorable for a move lower into next year. The alternate is that the wave (ii) is not yet finished though it is becoming a more distant possibility.
Natural Gas via (UNG) 2017-10-14
The outlook for UNG has not changed over the last few months. It has failed to rally much but then hasn't fallen either. Still favor a bounce that can test the highs from last year.
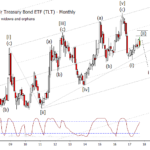
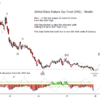
iShares 20+ Treasury Bond ETF (TLT) 2017-10-01
As you would expect, the analysis here is very similar to that done on bond futures earlier. This looks like a wave (ii) bounce though it is too early to rule out another test of overhead resistance.