
Gold mania
Don't get trapped

Can GLD just keep climbing?
We're cautiously watching for a pullback

Our bearish copper scenario is working well!
It's not too late to find the right trade

Gold ETF ready for breakout move
Our main scenario is bearish, but there's an alternate too
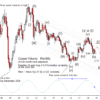
Copper Update 2019-03-10
Quick update on copper. Copper has softened against resist and either set a (b) wave high or 'a of a more complex (b)'. Looking at a daily chart there is some wiggle room for a modest new high in the short term if they react strongly to support at 2.88. I have also included a chart of the copper mining ETF COPX so as to have a visual of the possible complex (b) wave alternate.
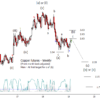
Copper Update: 2019-02-22
In the short term copper has advanced as I laid out in the last daily chart though reaching initial short term targets now so I thought I would give an update. Big picture, this is either working on a (b) wave or the first step up in a (b) wave depending on where you place the (a) wave low.

Which resistance line will put a lid on the copper bounce?
We expect a reversal
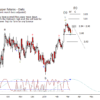
Copper Update 2019-02-17
Since the middle of last year, my view has been that copper needs to bounce in a (b) wave as preparation for rolling down again in a (c) wave. Copper is now at an initial target for 'c of (b)' at 2.85. When dropping down to a daily chart, you can make a case for a little push up for one more wave up so as to get a five count up from the early January low. Once copper does roll lower, if it makes a higher low to the 2016 low, it will qualify as both a wave [b] or [ii]. If it eventually makes a new low to the 2016 low, it will be valid as a [b] wave low.

More decline ahead for copper mining fund
Bears need to wait for it to reset first
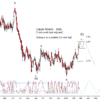
Copper Futures and Copper Miners ETF Update
Starting with the copper monthly chart for perspective. Primary thesis is that a large corrective formation completed at the 2016 low and that the climb up to the late 2017 high was the first impulse up from that low. That implies a corrective move lower and my assertion is that copper completed the first move of that correction in the summer of this year and due for a consolidative bounce before dropping in the last leg of the larger correction. I have penciled in the next corrective low to coincide with a cycle low middle of next year at a higher low to that of the 2016 low though a new price extreme in [b] would not break the pattern.