
Our bearish copper scenario is working well!
It's not too late to find the right trade
Newsletter: Copper forecast – special extended version
This post is exclusively for readers of our emailed newsletter. It features an updated version of the weekly timeframe analysis of copper futures that we posted for the general public on February...

Which resistance line will put a lid on the copper bounce?
We expect a reversal
Copper Futures and Copper Miners ETF Update
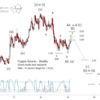
Starting with the copper monthly chart for perspective. Primary thesis is that a large corrective formation completed at the 2016 low and that the climb up to the late 2017 high was the first impulse up from that low. That implies a corrective move lower and my assertion is that copper completed the first move of that correction in the summer of this year and due for a consolidative bounce before dropping in the last leg of the larger correction. I have penciled in the next corrective low to coincide with a cycle low middle of next year at a higher low to that of the 2016 low though a new price extreme in [b] would not break the pattern.

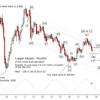
Copper mining fund points downward
Here are some potential entry areas

Bearish prospects for copper
But manage your short positions now
Copper Update (Futures and a mining ETF)
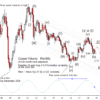
I relatively recently updated the copper futures charts as requested by a subscriber. At that time, my view was that copper was moving down in the last leg of wave (a) down from the high from late last year. I now think that (a) may be complete and ready to embark on a few months of choppy retrace up. Below you will find monthly and weekly copper futures charts and also monthly and weekly charts of a copper mining ETF (COPX).
Copper Futures Update
By request, refreshing the copper analysis. Copper has been falling in line with the forecast from late last year. I think this is probably the first move down in wave [b] or [ii].
Copper ETF poised for downward move
A sizable correction is due
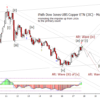
iPath Dow Jones-UBS Copper ETN (JJC)
I went ahead and did the copper analysis for the respective ETN. I've added some additional chart geometry and the Wave 59 9-5 study to the monthly chart but otherwise the story is the same as for copper futures.